A few years ago I personally attended a talk delivered by Tony Hoare. Amongst other things I very much enjoyed his remarks on performance. I hope I will never forget and never fail to act on his famous quote "premature optimization is the root of all evil". I have seen the horrible results of hand optimizing Go code by default and I want to avoid that my codebase looks anything like that. Today I like to get started with some performance checks of the Go codebase I have been working on. Of cause I start with some profiling...
Brad Fitzpatrick gave an excellent talk at YAPC::Asia Tokyo 2015 that will help to get us started on Go datatypes, profiling and optimization techniques.
I am working on GoGrinder (a performance test runner). Normally you would instrument and optimize the server and not the test runner. But the methods and tools I use here are the same. The scenario runs 600 concurrent users that send http get and post requests against a tiny latency-sim-server.
The runtime/pprof package we use for profiling is part of the Golang runtime - no need for any additional installations.
instrumenting the code (main function):
import (
        // ... other imports
        "runtime/pprof"
)

func main() {
        {
                // creating a CPU profile
                f, err := os.Create("cpu.pprof")
                if err != nil {
                        fmt.Println("Error: ", err)
                }
                pprof.StartCPUProfile(f)
                defer pprof.StopCPUProfile()
        }
        // ... normal main program
build the instrumented binary:
$ go build gogrinder.go
start the airbiscuit latency server:
$ ./airbiscuit 30
in another shell run (in parallel) the instrumented GoGrinder binary:
$ ./gogrinder -no-frontend gogrinder_loadmodel.json
create the diagram:
$ go tool pprof --png gogrinder cpu.pprof > callgraph.png
The resulting callgraph diagram shows how the CPU is utilized on different aspects of the program including runtime. I looked for familiar elements which are part of the GoGrinder implementation.
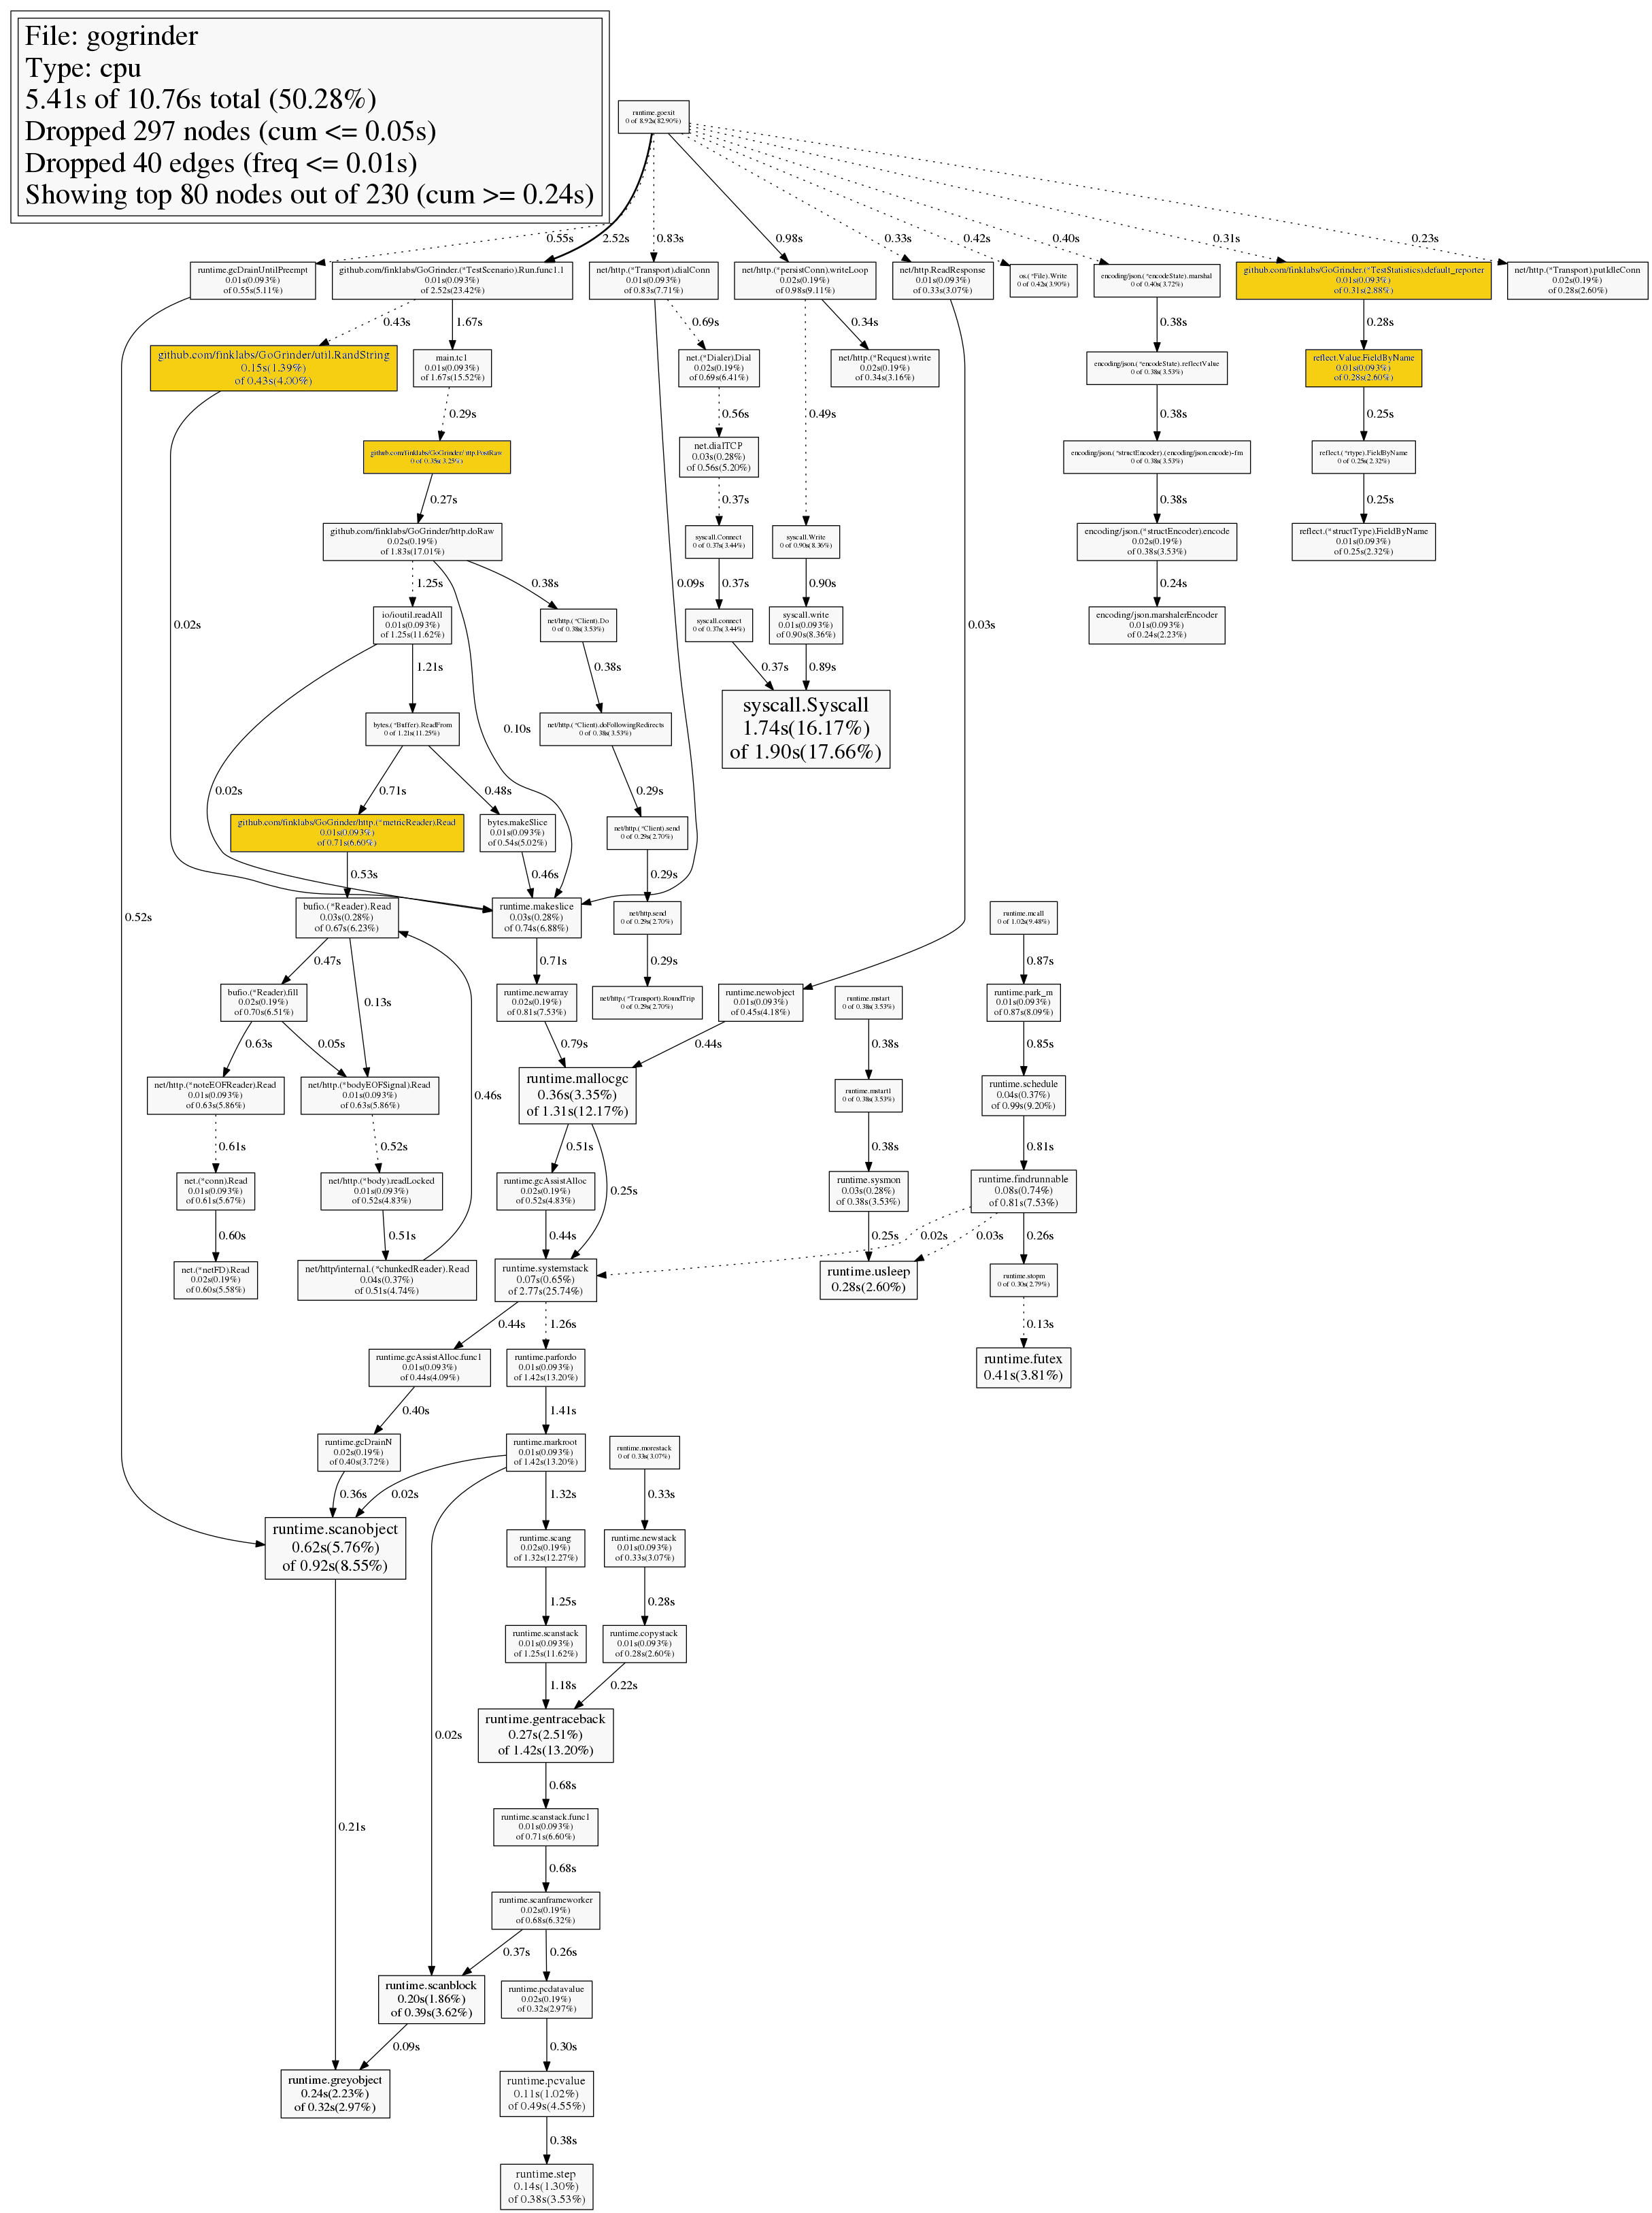
[zoom in for more details]
The callgraph diagram shows significant activity of the garbage collector. So it makes sense to create a memory profile, too.
Best, Mark
Resources
- https://github.com/bradfitz/talk-yapc-asia-2015/blob/master/talk.md
- https://github.com/finklabs/GoGrinder
- https://github.com/finklabs/GoGrinder-samples/tree/master/benchmark